Visualizing Influence Relations of Programming Languages
The first programming languages were created before modern computers existed. Between 1842-1843 Ada Lovelace specified a method for calculating Bernoulli numbers with the Analytical Engine, recognized by some historians as the world's first computer program. The first programming languages designed to communicate with a computer were written in the 1950s, since then hundreds of programming languages were created.
Naturally, some of those languages had a larger impact than others, Lisp and C for example were developed in the late 1950s and 1960s respectively and are still widely used, many newer programming languages are implemented in C. The impact of a language is not limited to its usage but is also manifested in its influence on other languages. To visualize these influence relations I created different network graphs described hereafter.
The data on programming languages, their influence relations and the programming paradigms they are classified into comes from the Freebase Programming Language collection, which is largely based on information from Wikipedia. Freebase data is not necessarily correct or complete. If you spot an error, please let me know in the comments and, if you can, correct the information on Freebase.
All of the described visualizations have several features in common:
- Programming languages are displayed as nodes in the form of circles.
- Influence relations are displayed as edges in the form of lines (straight or curved).
- Node sizes reflect the number of languages a language has influenced, i. e. outdegree.
- A programming language can pertain to different programming paradigms.
Programming Languages Influence Visualizations
My first attempt in October 2011 to visualize programming language influence resulted in these static graphics created with the NetworkX and matplotlib Python libraries. Each graphic shows the influence relations of programming languages that pertain to a specific programming paradigm, e. g. object-oriented programming, procedural programming or functional programming to name a few. The languages are arranged in circular layouts.
In August/September 2012 I gave another go at this topic resulting in this browser based visualization created using D3.js. This graph consists of 1170 nodes and 908 edges with a force layout being applied as you browse. There is not much more to say about it except that I wasn't really satisfied and looked for alternative tools, which I found in the JavaScript library sigma.js and the Gephi visualization platform. Both these tools were fundamental for creating the interactive visualizations described in more detail below.
Interactive Visualizations Created with Sigma.js and Gephi
I retrieved the data for these visualizations with a Python script you find in this repository. This script also creates a gexf file, which I then manually edited using Gephi.
To render the edited gexf files in a Web browser I used Sigma.js and developed the following ways of interacting with the displayed information from the top menu bar and using the mouse:
- Search languages and highlight their connections from the autocomplete input field in the top bar. In the highlighted mode languages shown in orange influenced the highlighted language and blue ones were influenced by it.
- Filter by programming paradigm from the dropdown in the top menu and you'll only see languages that pertain to the selected paradigm. Note that the node sizes don't change when the paradigm filter is active, which should be improved.
- Click on a node to display a modal window with more information about the programming language.
- Zoom the graph using the mousewheel and drag it around holding the mouse button clicked.
Let's now look at the details for the different interactive versions.
Programming Languages Influence 2013
The data for the 2013 version was downloaded on July 11, 2013 and contains information on 1183 programming languages, the nodes in the network. These languages are connected by 972 influence relations shown as edges. The 10 most influential languages are listed below:
Lisp was originally specified in 1958 and the development of C began in 1969. So 2 fairly old languages within the period we are looking at are the most influential ones. But age alone does not account for that, as languages like COBOL and Fortran, which also appeared in the 1950s, are considerably less influential and Java, which was released in 1995, is highly influential.
Adoption of a language is certainly a major factor for its influence, which can be driven by marketing (Java), coincidence, e. g. being hastily created as the language for Web browsers (JavaScript), ease of use (Python) or usage as a teaching language (Pascal).
I created the graph layout applying ForceAtlas2 and an algorithm to prevent label overlap and also manually placed nodes. The nodes are colored based on the group of programming paradigms they belong to.
Print versions of the whole network can be ordered from several retailers.
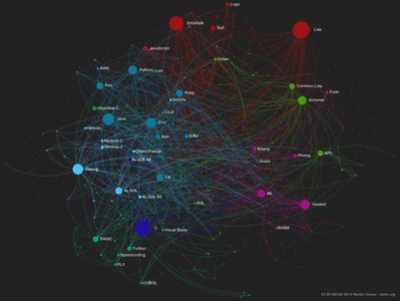
Programming Languages Influence 2014
The data for the 2014 version was downloaded on September 8, 2014 and contains information on 1220 programming languages connected by 1137 edges. The 10 most influential languages are as follows:
The ranking hardly changed only ALGOL was surpassed by ML and the numbers of influenced languages increased as did the overall number of languages in the network.
For this graph I applied a ForceAtlas layout with high repulsion strength and the attractive force distributed along outbound links so hubs are pushed outside and authorities to the center. Additionally, I ran algorithms to prevent label and node overlap in Gephi.
In contrast to the previous version language nodes are colored based on their Modularity Classes , which were calculated using an algorithm devised by Vincent D Blondel, Jean-Loup Guillaume, Renaud Lambiotte, Etienne Lefebvre in the paper Fast unfolding of communities in large networks. Thus coloring reflects properties of the network rather than properties of the languages.
There are two posters for the 2014 graph, one that shows only influential languages, i. e. those that have influenced at least one other language, and one poster of the full graph.
tl;dr
I created visualizations to show influence relations across hundreds of programming languages. There are two browser versions you can interact with: one with data from 2013 and a newer one with data from 2014.
Feel free to leave feedback in the comments and share this visualization with your friends.
Update 2019-01-24
I had plans to update this project for a while and eventually created a whole website about programming languages and launched it in December 2018. Besides dedicated pages for each language with relevant information and resources, there is an influence network graph using Wikidata as the data source. In this visualization the graph layout, node sizing and coloring is all done in JavaScript using D3.js, which makes it a lot easier to update. I intend to do data updates regularly and add more information to the language pages to make it a useful resource for programmers and everyone interested in programing languages. Hope you'll check it out and enjoy it.
Published on September 07, 2012 (updated on January 24, 2019) by Ramiro Gómez (@yaph). To be informed of new posts, subscribe to the RSS feed.
Tags: network graph, programming, sigmajs, gephi, networkx.
Visualizations
 View Visualization
 View Visualization
Visualization Posters


Source Code
Check out the source code used to process the data and create the visualizations.
Code Repository