A Network Graph of Human Diseases
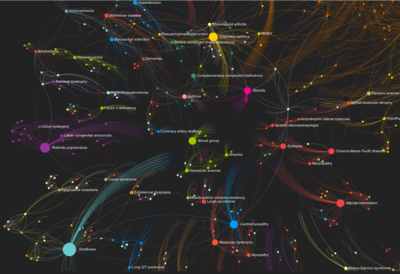
A network of disorders and disease genes linked by known disorder-gene associations from the study The Human Disease Network, Goh K-I, Cusick ME, Valle D, Childs B, Vidal M, Barabási A-L (2007), Proc Natl Acad Sci USA 104:8685-8690. Disorders and genes are nodes in the graph. A disorder's size corresponds to the number of genes known to be associated with it.
The graph dataset for this visualization comes from the Diseasome project by Mathieu Bastian and Sébastien Heymann. In its original version the interactive graph used their dataset as is. The current version created in November 2018 uses the same coloring and sizes but a different layout applied in Gephi and is rendered in the browser with sigma.js.
Graph Navigation
You can zoom in and out the graph with the mouse wheel. You can move the graph by clicking and holding the left mouse button and moving the mouse. When you zoom into the graph more node names will be shown. To highlight disorders or genes and their connections type the name in the top menu's search form.
Published on September 27, 2012 (updated on November 18, 2020) by Ramiro Gómez (@yaph). To be informed of new posts, subscribe to the RSS feed.
Tags: network graph, sigmajs, gephi.